Economic headlines can be confusing when one report points to growth while another signals strain. To understand Canada's economy, it helps to follow a small group of indicators consistently rather than react to a single monthly release.
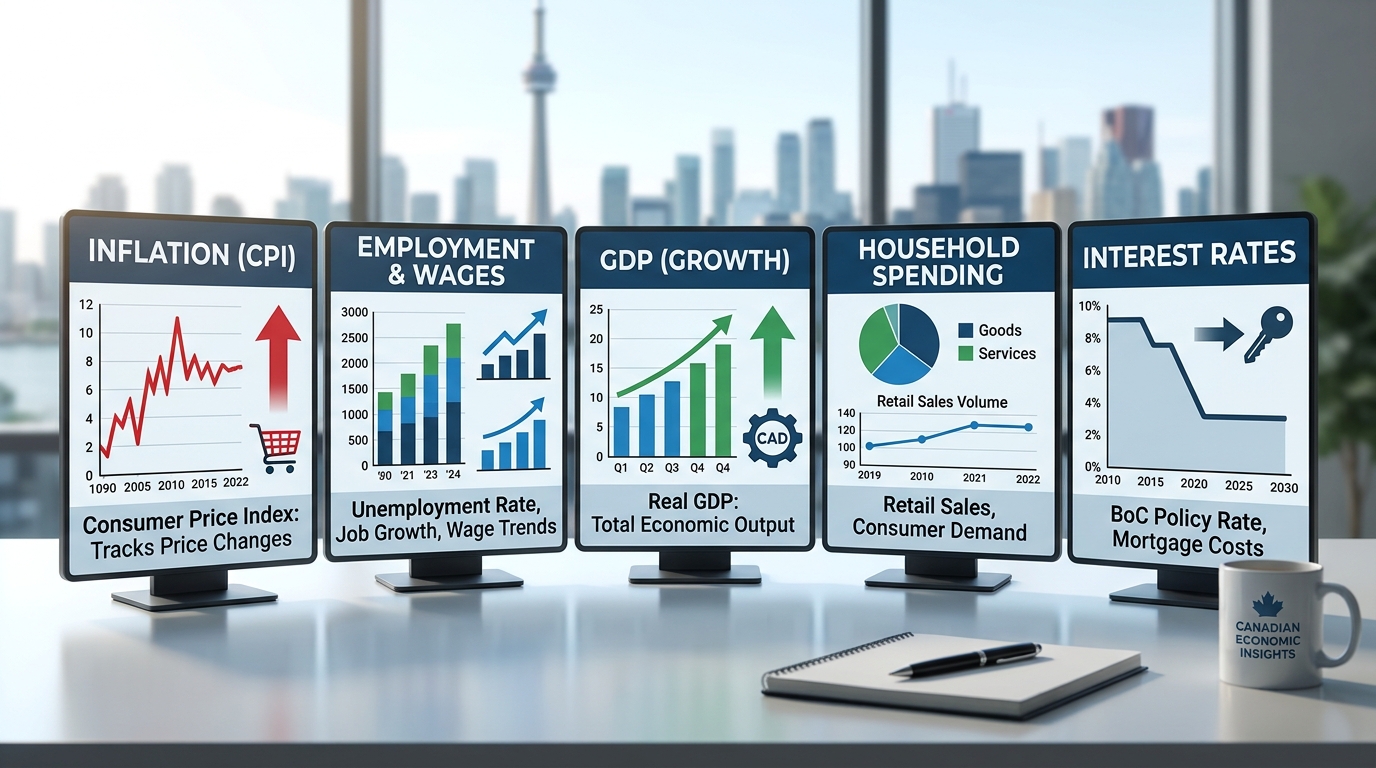
No indicator tells the whole story. Inflation measures price changes, employment reports on the labour market, and gross domestic product (GDP) estimates economic output. Household spending and interest rates add context about demand and borrowing conditions. Read together, these measures provide a more balanced picture of how the economy is performing.
1. Inflation: Are prices still rising quickly?
Inflation measures how quickly the prices of goods and services change over time. In Canada, the Consumer Price Index (CPI), published by Statistics Canada, is one of the main measures used to track consumer-price inflation.
Inflation matters because it affects the purchasing power of household income. If prices rise faster than wages, people may find that groceries, housing, transportation and other essentials take up a larger share of their budgets. Even when inflation slows, the overall price level generally does not return to where it was before; prices are simply rising more slowly.
When following inflation, look beyond the headline rate. The categories contributing most to the change can matter as much as the total. Housing-related costs, food, energy and services may behave differently, and temporary movements in one category can make the overall rate harder to interpret.
What to watch: The latest CPI release, changes across major categories, and whether price increases are broad-based or concentrated in a few items.
2. Employment and wages: How strong is the labour market?
Statistics Canada's Labour Force Survey reports measures such as the unemployment rate, employment, participation and average wages. Together, these figures help show whether people are finding work and how labour-market conditions are changing.
A rising unemployment rate can indicate that jobs are becoming harder to find, but it should be read alongside employment growth and the participation rate. For example, unemployment can rise when more people start looking for work, even if employment is also increasing. Similarly, a strong employment headline does not necessarily mean all regions, industries or age groups are experiencing the same conditions.
Wages provide another important piece of the picture. Comparing wage growth with inflation helps indicate whether workers' purchasing power is improving. However, average wages can shift because the mix of jobs and workers changes, so one report should not be treated as a complete measure of household well-being.
What to watch: The unemployment rate, employment change, participation rate and wage growth relative to inflation.
3. Gross domestic product: Is the economy growing?
Gross domestic product, or GDP, estimates the value of goods and services produced in the economy. Statistics Canada publishes quarterly GDP estimates and monthly information on real GDP by industry.
Real GDP adjusts for price changes, making it more useful than nominal GDP for assessing whether the volume of economic activity is expanding. GDP can help answer whether output is growing, slowing or contracting, but it is released with a lag and estimates can be revised as more information becomes available.
The headline growth rate also hides differences between sectors. Consumer-facing services, construction, manufacturing, energy and other industries may move in different directions. GDP per person can add context by comparing output with population growth, although it does not capture every aspect of living standards or how income is distributed.
What to watch: Real GDP growth, GDP by industry, revisions to earlier estimates and GDP per person when considering changes in average economic output.
4. Household spending and retail sales: Are consumers pulling back?
Household consumption is a major part of Canada's economic activity. Retail-sales data provide a timely view of spending at retailers, while national accounts provide a broader measure of household consumption that includes many services as well as goods.
When households feel confident about income and job security, they may be more willing to spend. When budgets are squeezed by housing costs, debt payments or uncertainty, they may postpone purchases, trade down to cheaper options or reduce discretionary spending.
Retail sales are not the same as total household spending. They cover retail businesses and can be affected by price changes, seasonal patterns and shifts between types of purchases. Where possible, distinguish between sales values and volume measures that adjust for price changes.
What to watch: Retail-sales growth, the volume of sales where available, and whether spending is strengthening broadly or being supported by only a few categories.
5. Interest rates and borrowing costs: What does money cost?
The Bank of Canada sets its policy interest rate to support price stability, with an inflation target of 2% within a 1% to 3% control range. Changes in the policy rate influence, but do not directly determine, the rates households and businesses pay.
Mortgage rates, lines of credit, business loans and savings rates respond to different market conditions and contract terms. Higher borrowing costs can make new mortgages and business investment more expensive, while lower rates may ease some pressure on borrowers. The effects take time and vary according to whether a household has a fixed or variable mortgage, when it renews, and how much debt it carries.
The policy rate should not be interpreted in isolation. The Bank of Canada considers a range of information about inflation, demand, employment and economic capacity when making decisions. Market interest rates can also move in anticipation of future policy changes.
What to watch: The Bank of Canada's policy-rate announcements, mortgage and lending rates, and the timing of mortgage renewals for households exposed to rate changes.
How to read the indicators together
The five indicators are most useful when viewed as a set. For example, slowing inflation alongside steady employment and improving real output may suggest that price pressures are easing without a sharp deterioration in activity. By contrast, weak output, rising unemployment and falling real retail-sales volumes may point to broader economic weakness.
Signals can conflict for good reasons. GDP estimates arrive on a different schedule from employment and inflation data; some measures are revised; and national averages can conceal important regional and industry differences. It is usually better to look for a pattern across several releases than to draw a conclusion from one surprising number.
A simple monthly routine can help:
- Read the latest CPI release to understand price changes.
- Review the Labour Force Survey for employment, unemployment and wages.
- Check the latest GDP releases for the direction of economic output.
- Review retail sales for clues about consumer demand.
- Read the Bank of Canada's policy-rate announcement and explanation for its decision.
Always check the release date and the period covered by the data. A report published this month may describe conditions from the previous month or quarter.
What these indicators cannot tell you
Economic indicators describe broad patterns, not the experience of every household or business. A national unemployment rate does not show every local job market. Average inflation does not match every family's spending basket. GDP growth does not show how gains are distributed, and interest-rate changes affect borrowers differently.
These measures are best used to frame questions, compare trends and understand policy decisions—not to predict the future with certainty or make financial decisions based on a single data point.
The bottom line
To follow Canada's economy, start with five indicators: inflation, employment and wages, real GDP, household spending and interest rates. Each measures a different part of the picture. Together, they can help readers distinguish changes in the cost of living from changes in economic activity and understand how conditions may affect households and businesses.
The most useful signal is rarely one headline figure. It is the pattern that emerges when several reliable measures are considered over time.
Sources and further reading
- Statistics Canada — Consumer Price Index
- Statistics Canada — Labour Force Survey
- Statistics Canada — Gross domestic product
- Statistics Canada — Retail trade
- Bank of Canada — Policy interest rate
- Bank of Canada — Inflation-control target
*This article is for general educational purposes only and does not constitute financial, investment, tax or legal advice.*
Key takeaways
- Inflation shows how quickly prices are changing
- Employment and wages reveal conditions in the labour market
- GDP, household spending and interest rates help explain economic momentum and financial pressure